You can observe four graphics which describe the evolution of the industry.
Only the concentration of capital needs some explanation:
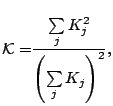 |
(3) |
where ![]() is the capital stock of firm
is the capital stock of firm ![]() .
.
This indicator gives an equivalent number of firms as if each of them had the same part of capital stock.
We have
![]() where
where ![]() is the number of active firms in
the industry.
is the number of active firms in
the industry.
The higher is this indicator, the more evenly balanced is the distribution of capital stock between firms.
This is an application of the Herfindall index to the capital stocks and summarizes the inequalities in the distribution of the capital stock.
The initial capital stock of firms is fixed in order to imply zero net desired investment.
Only an innovation in the industry can incite firms to modify their capital level at this stage.
The initial level of productivity is fixed high enough to let firms have positive profits and invest in R&D.
Initial values of ![]() and
and ![]() imply a probability of imitation of
imply a probability of imitation of
![]() and a successful innovative draw has a chance of
and a successful innovative draw has a chance of ![]() .
.
Investment increases the capital stock, and hence, the probabilities of successful draws.
We have also
![]() and two cases for
and two cases for ![]()
![]() and
and ![]()
These elements correspond to the following values:
![$\displaystyle %%
\begin{tabular}[c]{ccc}\hline
& \multicolumn{2}{c}{{\small Num...
...all0.16}\\
$\mathcal{D}$\ & {\small 67} & {\small 67}\\ \hline
\end{tabular}$](img67.gif)
![]() http://yildizoglu.u-bordeaux4.fr/nworig/nelwin.html
http://yildizoglu.u-bordeaux4.fr/nworig/nelwin.html
or
![]() http://cournot.u-strasbg.fr/yildi/nworig/nelwin.html
http://cournot.u-strasbg.fr/yildi/nworig/nelwin.html
for the Java version of the model.
The parameter table can be used to setup different elements of the model: